
Data makes the world go round - but there is so much of it that is impossible to see connections and glean valuable insights without the proper tools. No wonder dashboarding and analytics have become a crucial part of almost any project, since it's easier than ever for a business to determine and track their key performance factors, analyze them using business analytic tools, and ultimately visualize their impact on the bottom line via dashboards.
And yet, when asked, 93% of executives believe that their organization is losing revenue as a result of not being able to analyze and leverage their data to the fullest. How could this be? With all the capabilities of Business Value Dashboards, there's no reason why every organization shouldn't be able to make the most of every piece of data point collected.
Especially, in highly complex IT migration projects business value dashboarding is crucial. There are so many moving parts, interconnected resources, and dependencies as well as different teams - without these dashboards it is nearly impossible to discern what the bottleneck is that might be holding up thousands of units at the moment.
After all you would want to fly a plane without looking at the dashboards, right?
What Are Business Value Dashboards?
Before we dive into why Business Value Dashboards are so important for desktop migration projects, like for example a Windows 10 upgrade, let us spend a few seconds to define what Business Value Dashboards really are.
Here is Gartner's Definition of dashboards:
Dashboards are a reporting mechanism that aggregate and display metrics and key performance indicators (KPIs), enabling them to be examined at a glance by all manner of users before further exploration via additional business analytics (BA) tools. Dashboards help improve decision making by revealing and communicating in-context insight into business performance, displaying KPIs or business metrics using intuitive visualization, including charts, dials, gauges and "traffic lights" that indicate the progress of KPIs toward defined targets."
A Business Value Dashboard (BVD), on the other hand, connects IT metrics with the appropriate key business indicators and enables IT organizations to analyze, validate and communicate the value they contribute to the organization.
How Can Business Value Dashboards Help With IT Migration Projects?
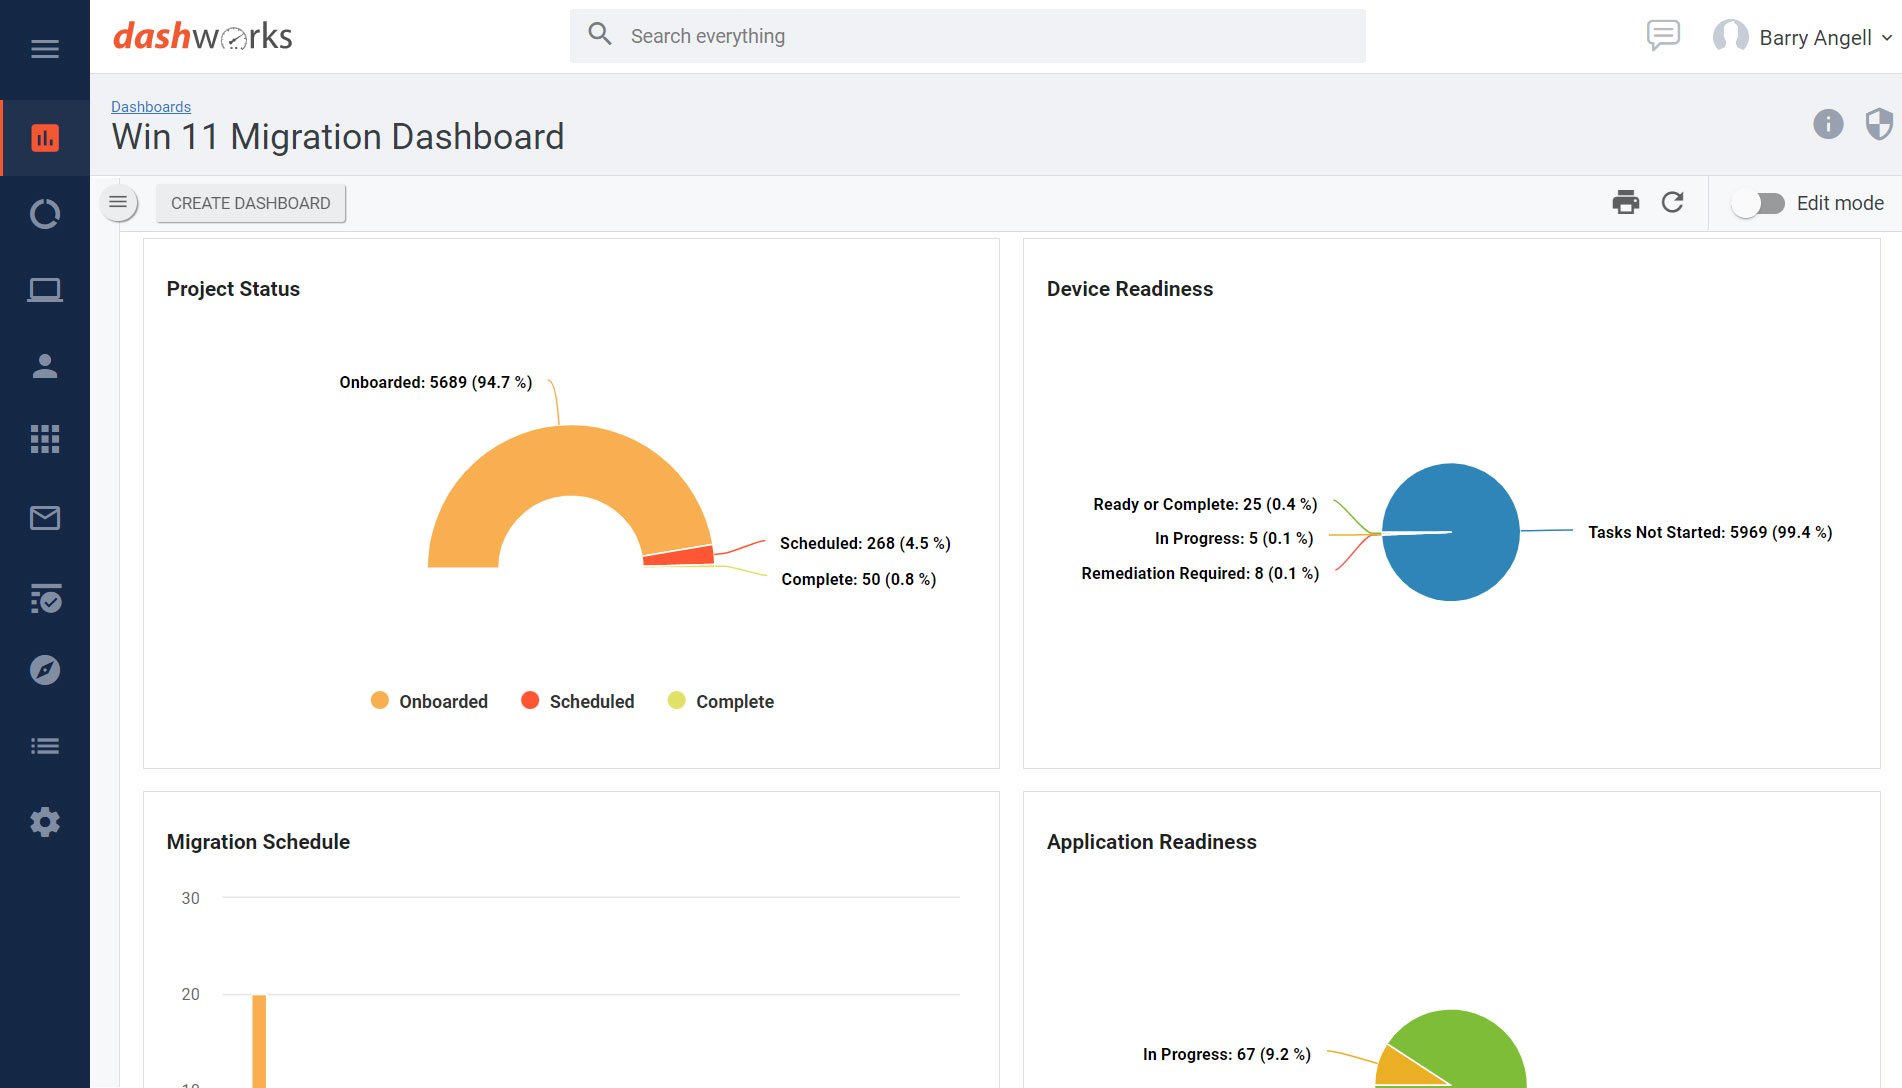
As previously mentioned, IT migration projects are incredibly complex, and include a multitude of resources and project team members such as schedulers, project managers, and executives. These people have all different information needs and, therefore, require slightly different views of the existing data, e.g., forecasts or deployments vs. forecasts.
With the power of today's management dashboards, it's possible for end users to personalize their dashboard to suit their exact needs. If an executive manager wants their dashboard to contain a hyper-specific set of data and management assets that a relevant to a given task, such as a large-scale IT migration, it can be done.
Now, a typical metric for a BVD could be the impact of website downtime on the company's online sales. But in our case, let's focus on how these dashboards can enable an IT migration project to run more smoothly.
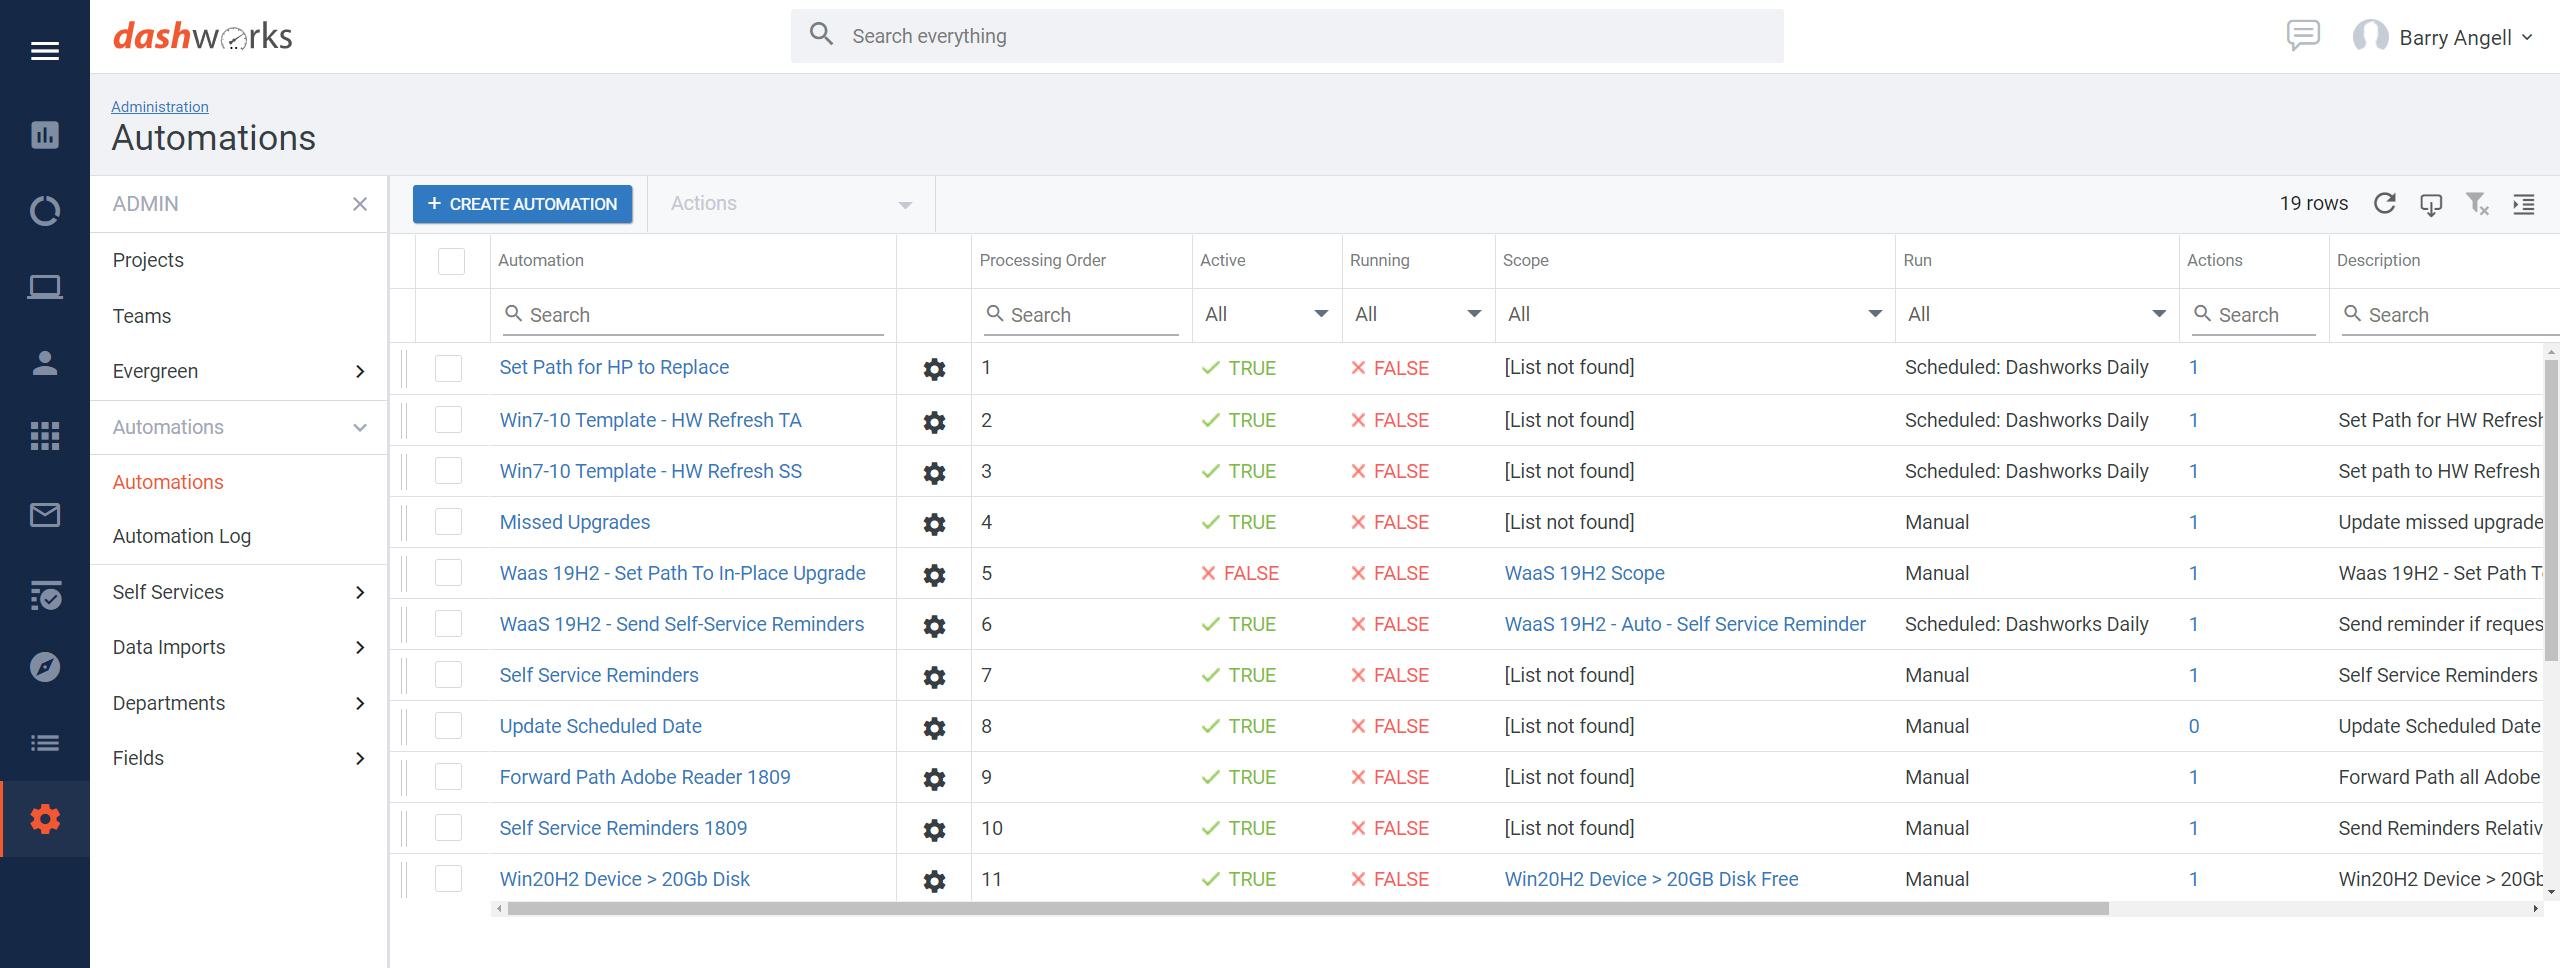
Data Visualization To Find Migration Bottlenecks
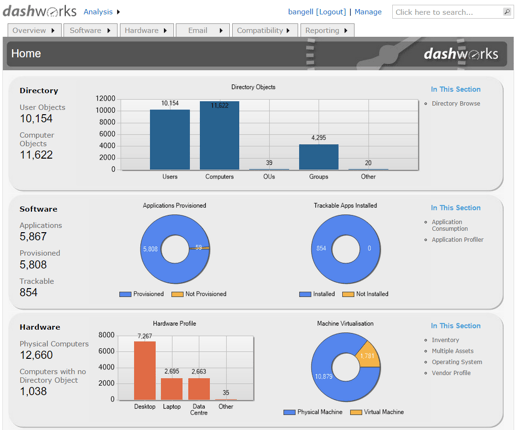
Business Value Dashboards allow IT teams to visualize and abstract all the relevant data for intelligence, prioritize, and ultimately get more numbers on the board.
It can help to highlight any under- and over-performing segments of the project, hence identifying any bottlenecks or opportunities to streamline the migration process. For example, you have thousands of users that are waiting for a piece of application infrastructure or network link, which is holding up your migration - but you would never know that if you are using spreadsheets to manage your project.
Streamline Your Process & Put More Numbers On The Board
Another very important argument for using Business Value Dashboards are the countless opportunities for streamlining your migration process. For example, if one vendor can only ship 1,000 machines to your location, not in 3, but 10 weeks, this has to be reflected in your migration project plan. Maybe there are other vendors who could deliver earlier or you can shift a different batch of migrations around to make up the lost time. This way, deployment technicians can do 20 machines a day, instead of maybe the usual 5 because they can track, measure, analyze and visualize all the existing data.
No More Blame Shifting Thanks To Data-Driven Discussion
Business Value Dashboards also enable all involved personnel to have a data-driven discussion, instead of pointing fingers and shifting blame. Now you are able to see which hick-ups or delays are holding up which part of the migration process - for example if you have in-house applications that are used by everyone, but the development team has not tested them in time and, therefore, delaying 20,000 migrations, you know you need to address the issue with them right away.
Conclusion
Business Value Dashboards are an essential part of any IT migration project as they allow IT managers, administrators, schedulers, executives and others to analyze and visualize all existing data, glean insights into bottlenecks and hold-ups and find ways to streamline their project as well as have data-driven discussions.
Topics:


.png)

%20vs.%20Juriba%20Dashworks%20(Updated%2041218).jpg?width=1600&height=900&name=Microsoft%20Windows%20Analytics%20(Upgrade%20Readiness)%20vs.%20Juriba%20Dashworks%20(Updated%2041218).jpg)


