
Last week, I introduced our Evergreen IT Process Framework which introduced a generalized framework of processes that can be applied to any Evergreen IT use case, whether it is a hardware refresh, an application lifecycle management, a VDI migration, or any other project. Many of you found the blog post useful. To make it even more actionable for you, I wanted to share with you some ideas on how to build an optimized tool stack around this process framework.
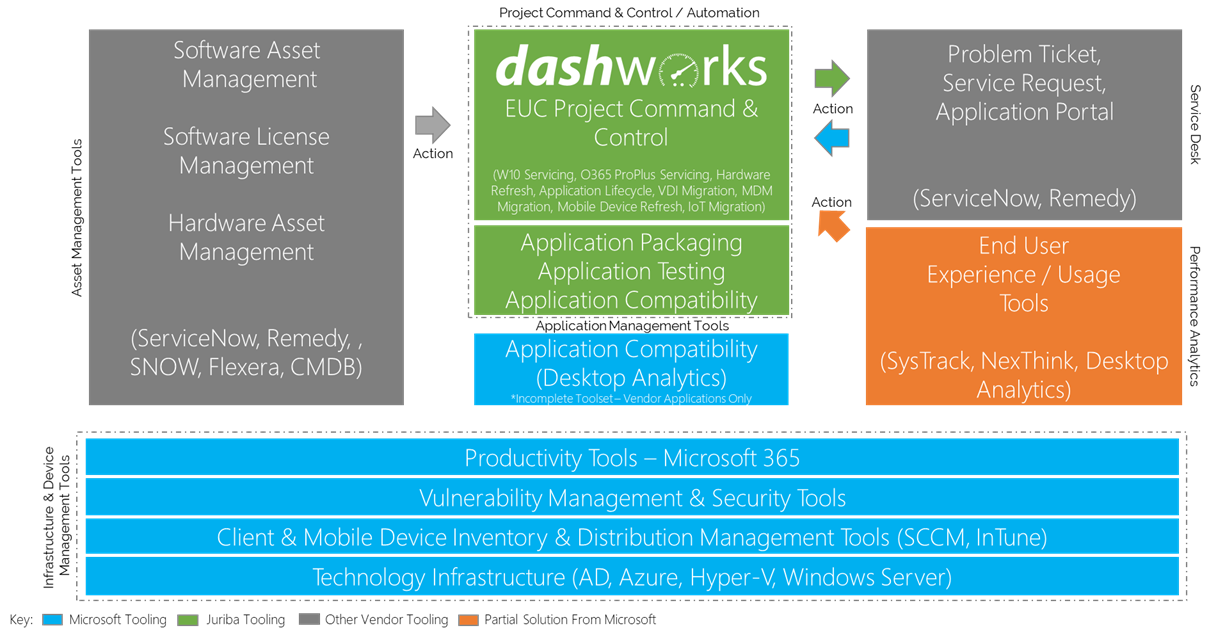
Below, I will outline how different vendors as well as Juriba's Evergreen IT Management tool, Dashworks, fit into the Evergreen IT Process Framework, how they can work together to help you create a smooth workflow, and where the value sits. Please keep two important things in mind:
- The list below is not complete or exhaustive. We included examples of vendors we have encountered often in our customer environments as well as tooling that offers the right type of functionality in that space to manage Evergreen IT successfully.
- This list does not mean your process depends on having every single tool on the list. The point is not to cobble together a massive, complex, and expensive tool stack, but rather to utilize what you already have in place and extract more value from the tools you already have invested in!
So, let's go through each of the five steps of the process framework and look at the tools in each step specifically.
1) Inventory & Analysis Tooling
The first phase of the Evergreen IT Process Framework is "Inventory & Analysis". In this phase, you have a huge list of tools as you are collecting all relevant data from different sources. The key thing to remember is that you will need to have multiple data sources and you need to choose the appropriate ones for the use case. Of course, the type of tools you will end up needing depends largely on the individual use case, but below is a list of tools that will give you an idea of the type of tools you will need.
There are lots of invaluable Microsoft tools, such as Microsoft Active Directory, Microsoft SCCM, Microsoft Desktop Analytics, Microsoft Intune, as well as Microsoft Exchange if you are running a mailbox migration or Office 365 ProPlus client rollout. In addition, tools like Aternity, SysTrack, Nexthink, Scalable, MobileLAN. Airwatch, Workspace ONE, ServiceNow, and Ivanti can be helpful. In addition, you might need to consume feeds from HR systems such as Workday, PeopleSoft, and SAP, or have built your own CMDB of useful information from which to derive complimentary asset data.
Now that you have all these different data feeds and tools, you will need some way of managing them all. Juriba's Desktop Analytics provides you not only with robust data connectors but also with a centralized data warehouse to manage all the data. It provides you with two key abilities:
- You can refresh all the data easily, which is crucial as all these systems are changing on a daily basis, and
- You are able to link all the relevant data objects appropriately.
For example, you need to be able to link the user to their device, their applications, their departments, their location, and so on. This all has to happen in a repeatable fashion so that you can cut, slice, and dice the data to do your analysis as quickly as possible.
2) Assess & Prioritize Tooling
In the second step, you will need tooling to help you assess and prioritize your in-scope data.
For example, if you are looking at application compatibility, you will need tools like Microsoft Desktop Analytics, Flexera, AdminStudio, Access IT Automation Capture, AppAvail, ApplicationReadiness.com, and Rimo3. Depending on your use case, the Microsoft Office Readiness Toolkit could also be useful.
However, it is important to be able to build your own flexible custom criteria. This enables you to set any asset that meets these criteria as "in scope and good-to-go" and filter out anything that doesn't meet the criteria. Once you are able to do that, you can use those assessments to determine what you should prioritize. These custom criteria are created and managed within Dashworks. Within the tool, you can then run mathematical algorithms to determine your path of maximum velocity. One example is the Dashworks Deployment Ring Analysis for Windows 10 Servicing Management.
Visually, you can imagine this step as a huge funnel. All the objects from the previous step are going into the top. On the left-hand side is an off-spout that drains all the objects that are not within the scope of this cycle. Within the funnel are filters or separators that stand for the different assessments you are running, e.g., an application compatibility assessment or a hardware compatibility assessment. These are your different tools that you are using. At the bottom of the funnel, you can visualize different separators that funnel objects with the same prioritization levels into a certain path. For example, this could be your deployment ring assignment.
3) Readiness Tooling
For the third step of the Evergreen IT Process Framework, we utilize tools that help us determine and manage our readiness. In terms of tooling, this list could, for example, include AppAvail, Flexera, AdminStudio, ServiceNow, Microsoft SCCM, Microsoft Active Directory, Microsoft Intune, and Workspace ONE.
In addition, we also have to manage some dependency tasks that are much more manual in nature, like business unit sign off or location sign off. With the right processes and tooling, this can almost become automated if you are using self-service. There also will be some additional data feeds feeding into your readiness tasks, such as application packaging or User Acceptance Testing. The key thing to remember when it comes to readiness tooling is that you must have a central way, like Dashworks, to manage all of these readiness activities.
4) Scheduling Tooling
The fourth step, scheduling, is rather straightforward with tooling which will all center around communicating with the end user and getting them to select their dates. To accomplish this, you can use ServiceNow, Remedy, 1E Shopping, and Dashworks Self Service. Try to automate as much of the heavy lifting here as possible by using automated communication and self service tools. But again, make sure that everything is managed centrally, for example, in Juriba Dashworks.
5) Deployment Tooling
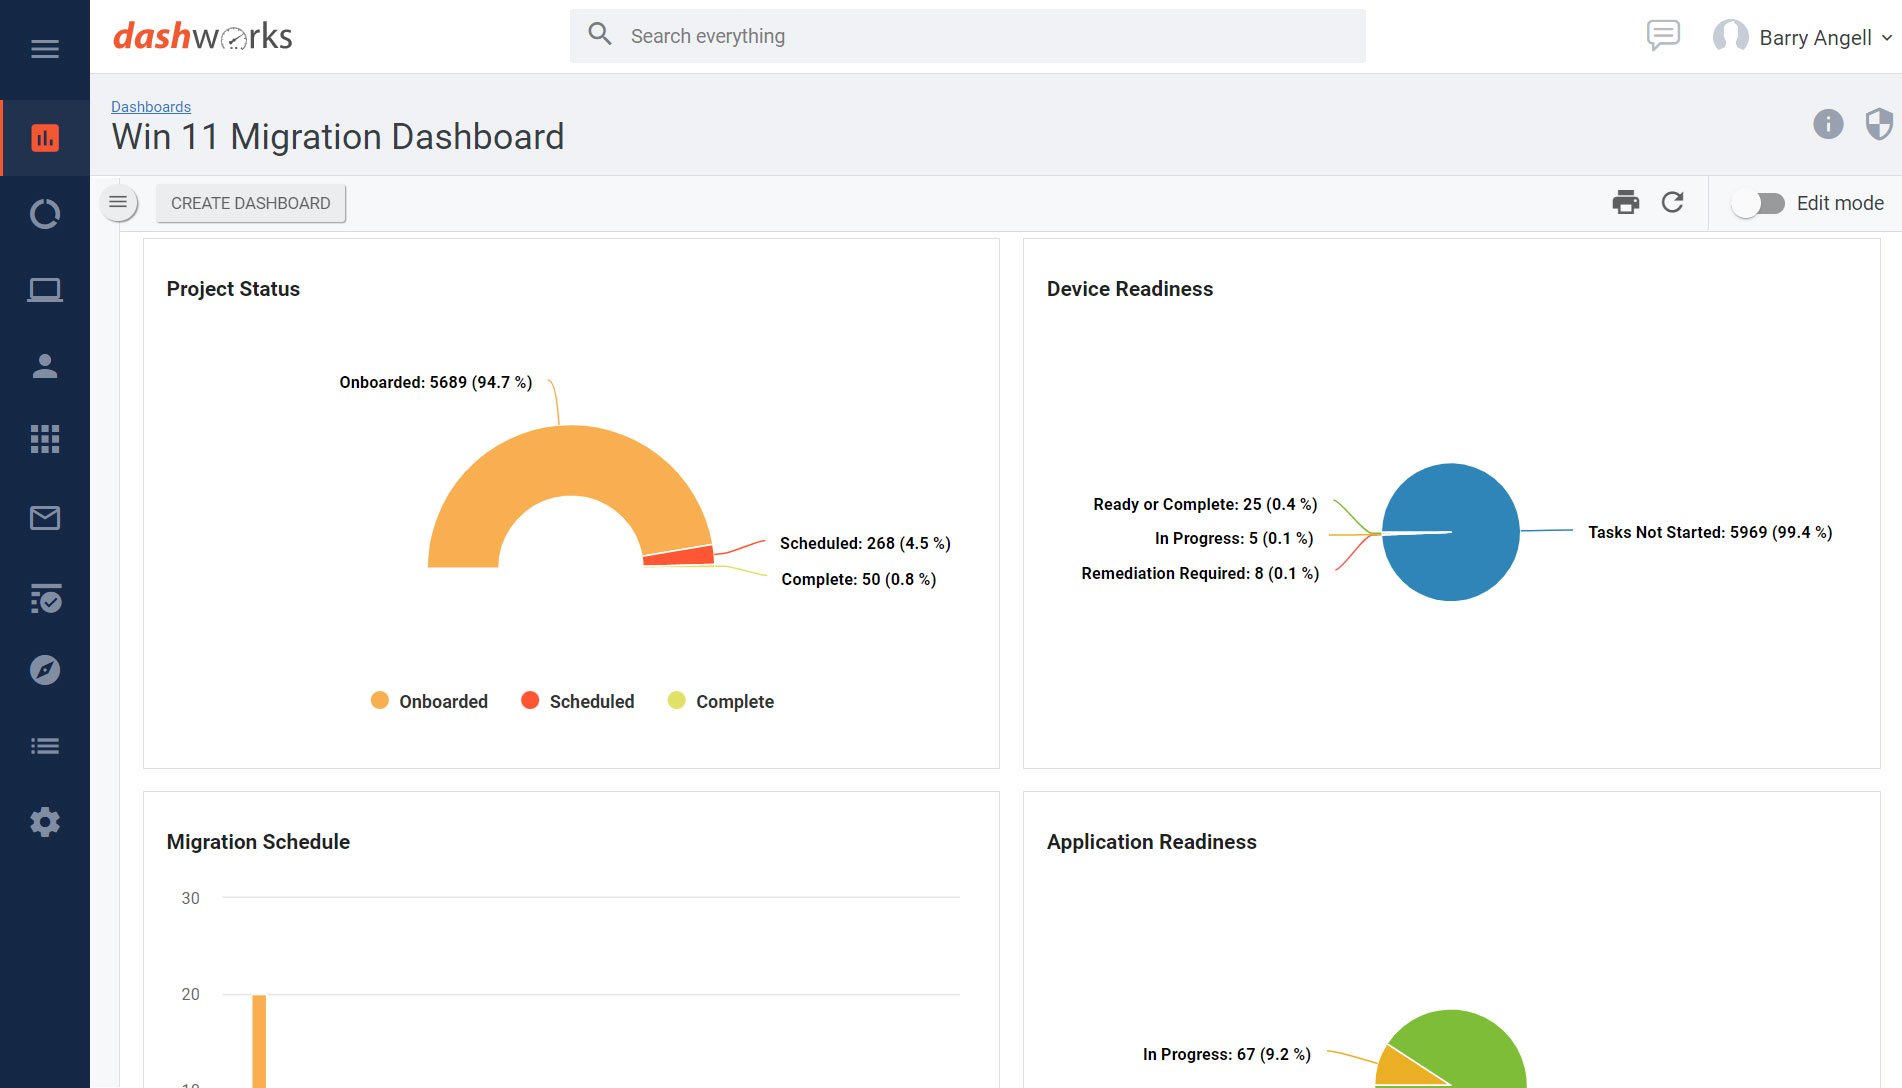
In the last step of the process framework, the deployment, you use your usual deployment tools like Microsoft SCCM, Microsoft Intune, Microsoft Active Directory, Workspace ONE, Airwatch, and so on. The key element here is how we trigger the deployment. After the deployment is finished, don't forget to use self service to collect end user satisfaction ratings, do your project end reporting (checkout Dashworks' Dashboarding for that), and wrap up your project to prepare it for the next cycle.
Conclusion
While managing your Evergreen IT Management cycles requires a lot of different tooling (especially in the first steps), the vast majority of tooling is already in your environment. By adding a centralized command and control center, like Juriba Dashworks, you not only are now able to connect all the different bits and pieces, but make logical sense of them, prioritize assets, and execute on tasks. Everything becomes trackable, on-the-fly manageable, and actionable. Juriba Dashworks allows you to centrally manage and therefore accelerate the entire end-to-end Evergreen IT Management process while extracting additional value from infrastructure pieces you already have in place.
Barry is a co-founder of Juriba, where he works as CEO to drive the company strategy. He is an experienced End User Services executive that has helped manage thousands of users, computers, applications and mailboxes to their next IT platform. He has saved millions of dollars for internal departments and customers alike through product, project, process and service delivery efficiency.






%20vs.%20Juriba%20Dashworks%20(Updated%2041218).jpg?width=1600&height=900&name=Microsoft%20Windows%20Analytics%20(Upgrade%20Readiness)%20vs.%20Juriba%20Dashworks%20(Updated%2041218).jpg)


