A few weeks ago, I participated in two interesting sessions at the Microsoft Ignite Tour: one about Microsoft Autopilot, which we have extensively covered in the past, and one about Desktop Analytics, which is the forthcoming upgrade to Microsoft's Windows Analytics telemetry tool. With the release due shortly, we thought we would share some information on this significant update.
If you prefer, you can also watch the recorded session and demo of Desktop Analytics with Matt Call and Amesh Mansukhani at Ignite below:
What is Desktop Analytics?
Before we dive into the key features and talk about how it will affect your Windows 10 and Office 365 deployment strategy, let's have a closer look at what Desktop Analytics is.
Desktop Analytics is a Microsoft service that aims to ensure application compatibility for enterprises upgrading to Windows 10 and Office 365 ProPlus. According to Microsoft, it will "create an inventory of apps running in the organization, assess app compatibility with the latest feature updates of Windows 10 and Office 365 ProPlus, and create pilot groups" for testing.
(Wondering what other Microsoft customers think of Desktop Analytics? Read about our first real-world impressions here.)

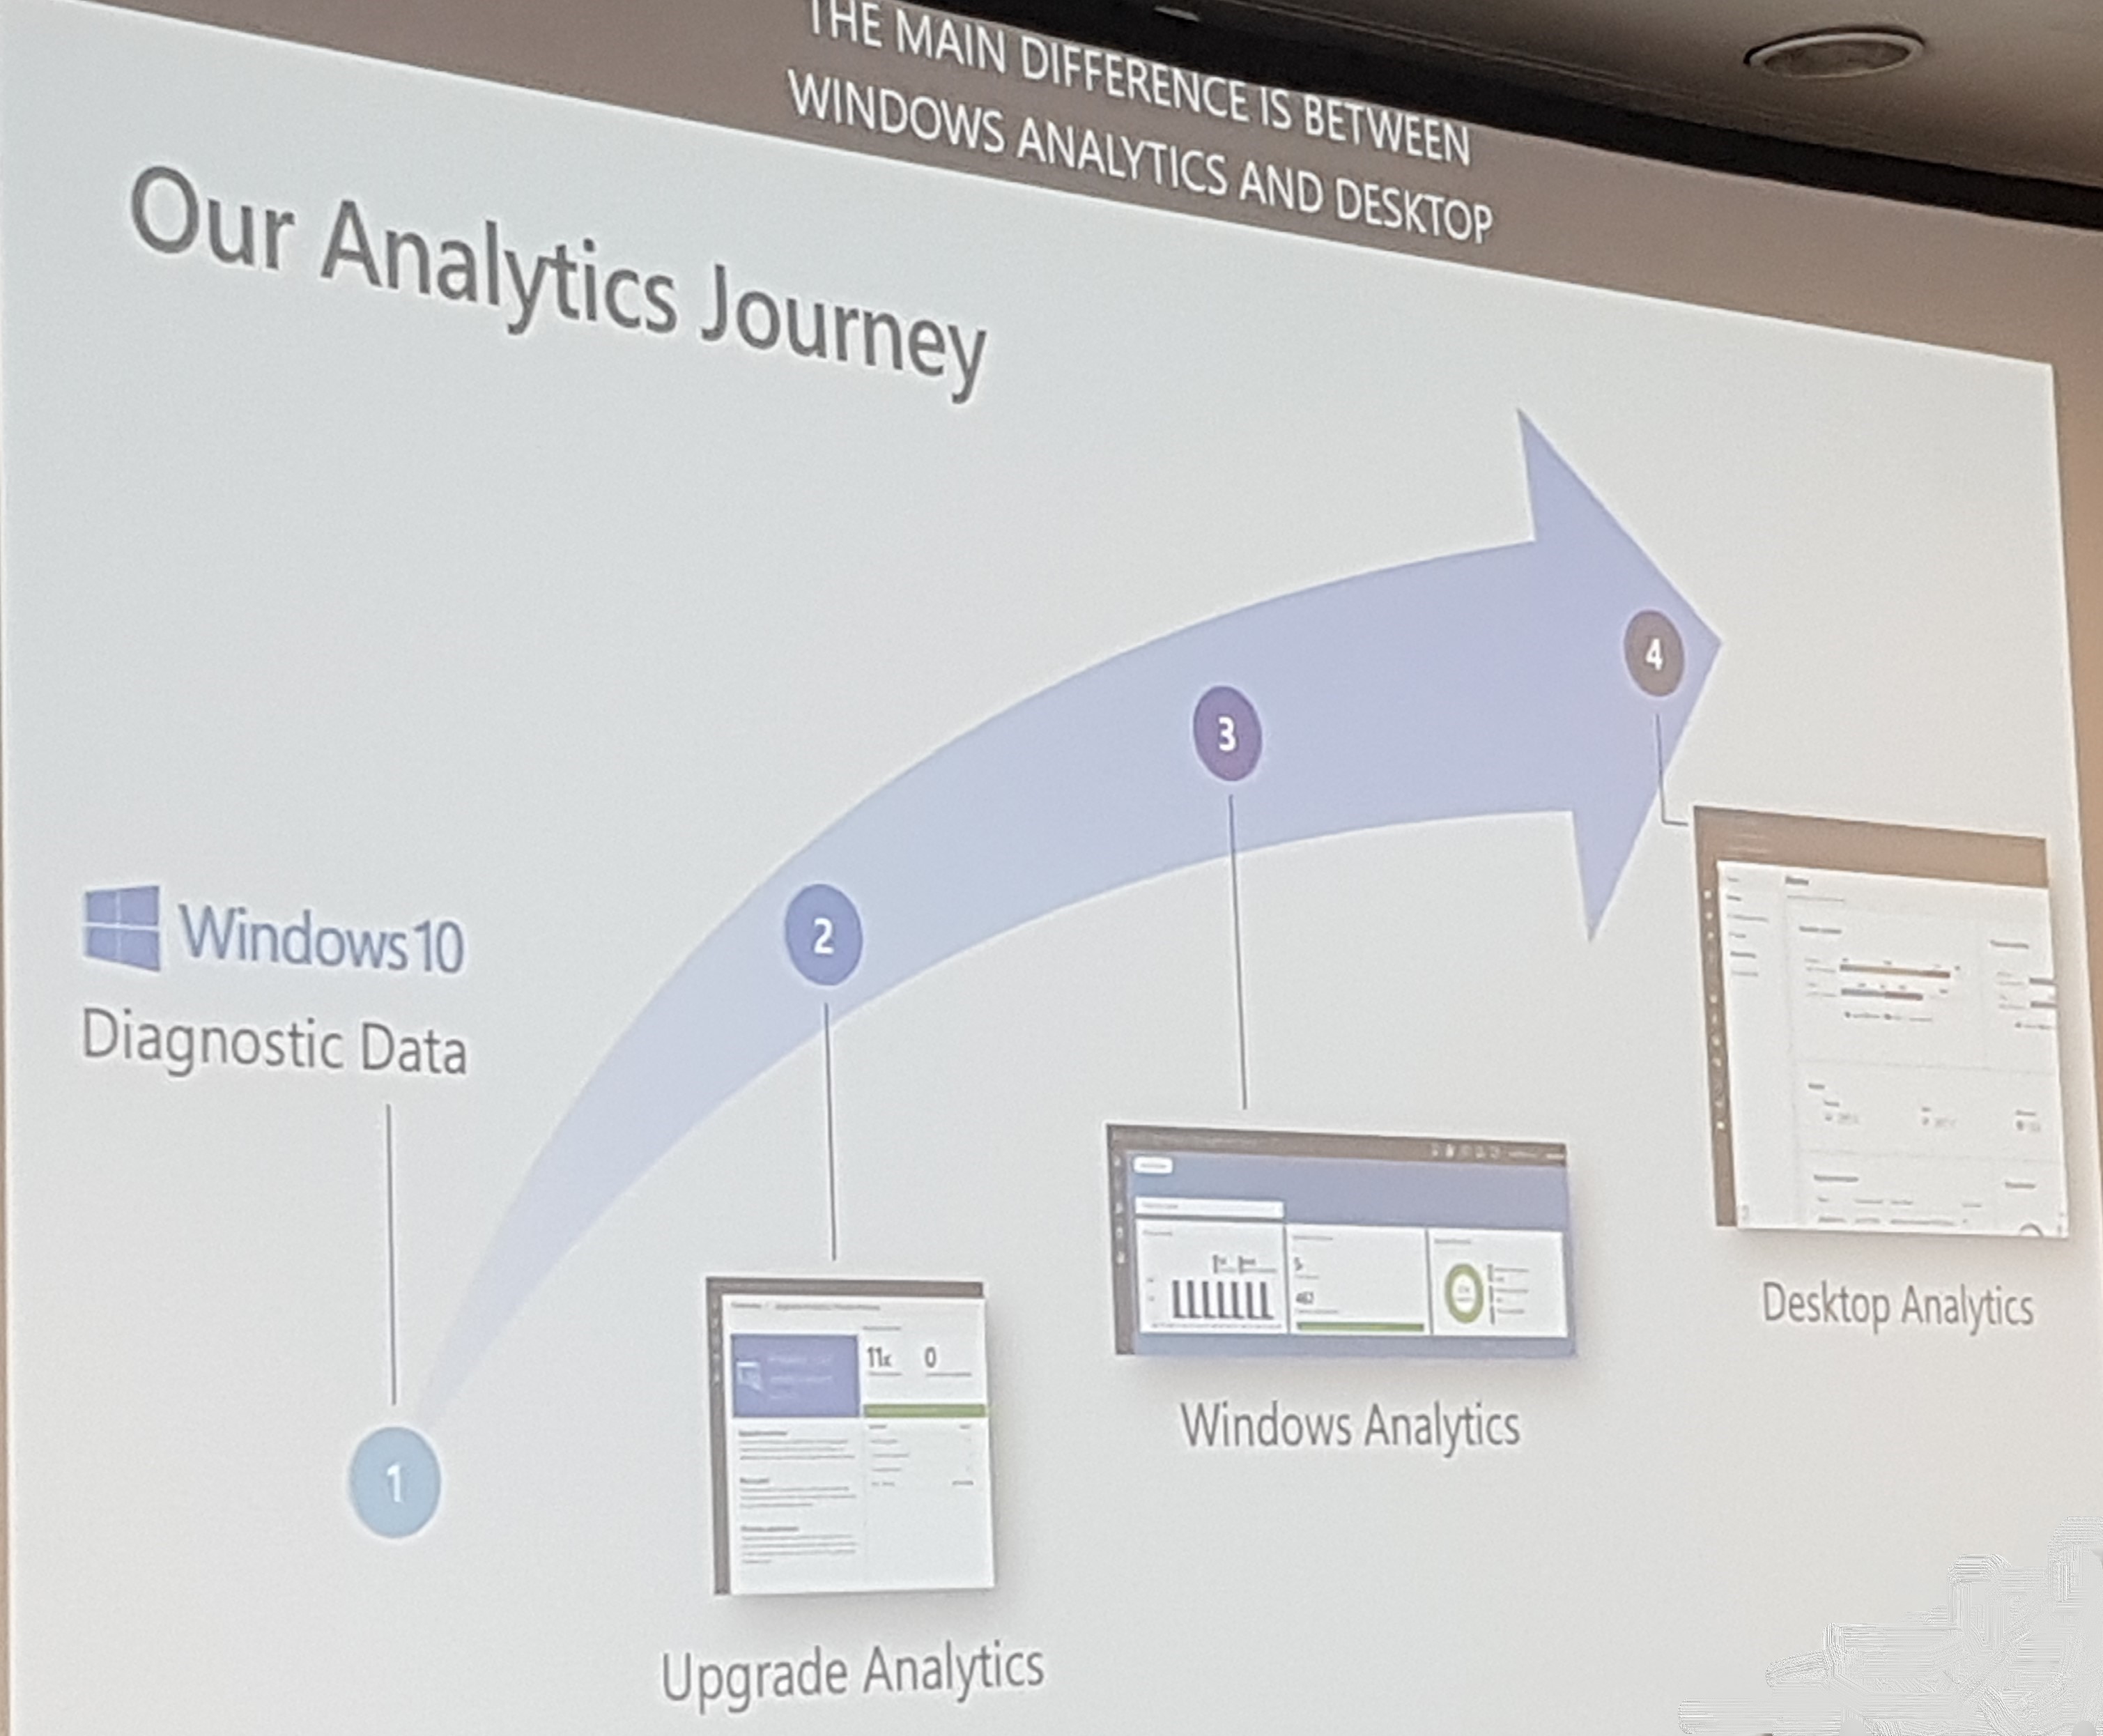
It is the successor of Windows Analytics (which stems from Upgrade Analytics and Windows 10 Diagnostics Data), but it includes a lot more functionality:
- Full Windows Analytics functionality with richer data
- Deep integration with Microsoft Management Tools, currently supporting ConfigMgr with Intune in a future release
- Single pane of glass for IT admins to manage and make decisions
- Full view of all assets of Windows and Office including apps, add-ins, macros, and settings
- Deployment monitoring and diagnosis for migration failures and successes
- Data driven pilot ring creation
- Pilot success and post upgrade health insights
It is important to note that, while it was announced in September 2018, Microsoft has not yet released a general availability date or a preview version yet.
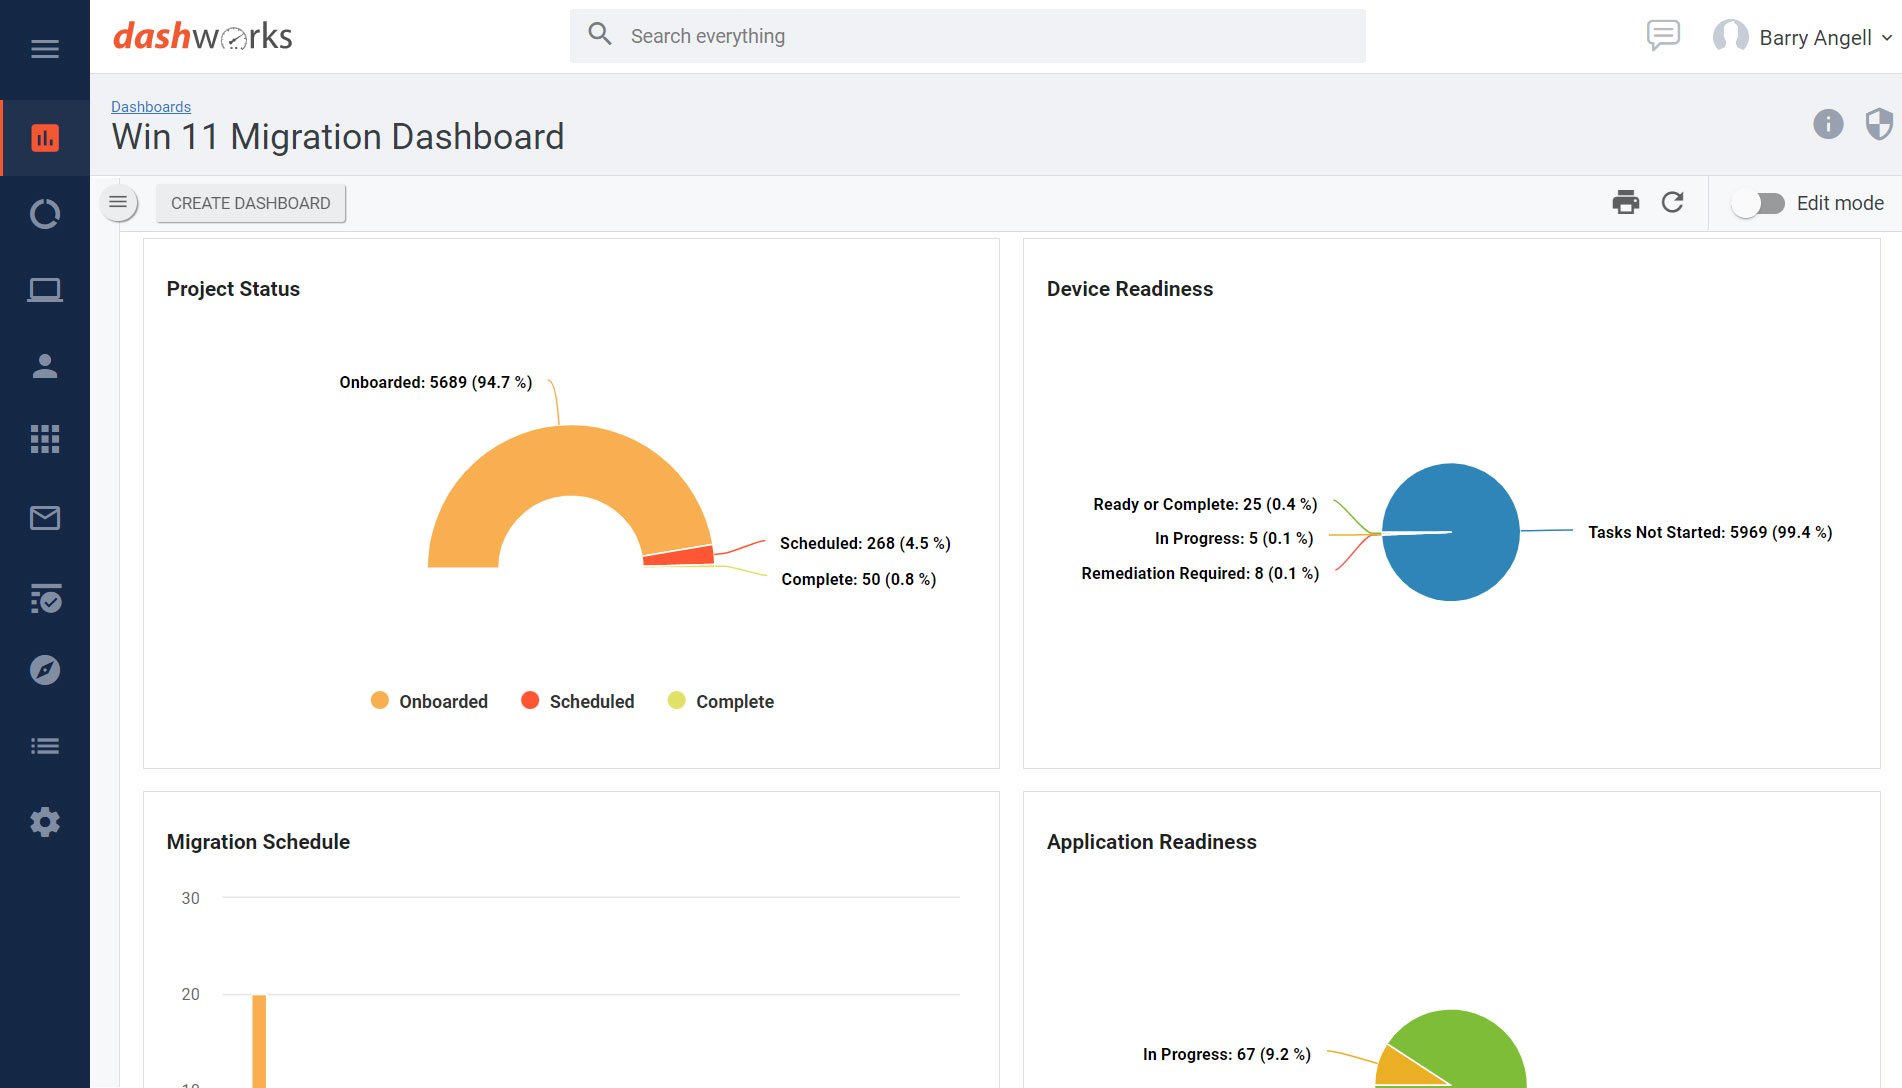
The Dashboard
The Desktop Analytics dashboard gives you a snapshot of your Windows and Office estate and shows key stats such as:
- Security Updates for Windows and Office showing the percentage of devices that are running the latest, near latest, or older version
- Feature Updates for Windows and Office showing the percentage of devices running an update that is in service, nearing end of service, or at end of service
- Total Assets broken down into devices, apps, Office apps, and Office add-ins
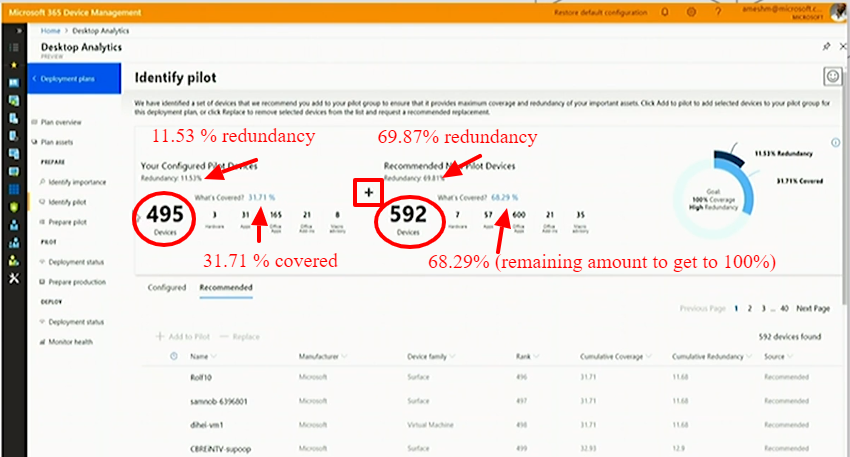
Due to the difficulty in reading the screenshot of the dashboards, I've annotated them to highlight key points.
Deployment Ring Planning
One main feature of Desktop Analytics is the ability to create a deployment ring plan by choosing which supported version of Windows and Office you want to install on which device groups (e.g., all, pilot ring, excluding C-level and other devices, etc.).
One of the biggest advantages of Desktop Analytics is the ability to create the most efficient pilot group that covers most, if not all of your IT landscape. While most organizations already have at this point a steady pilot group of several hundred devices, Desktop Analytics helps you to improve the effectiveness of your pilot phase with its deep integrations with Configuration Manager, micro service connectors, and AHA (App Health Analyzer).
In the example from the presentation below, 495 devices of the 87,470 total devices were enrolled in the current pilot group. However, running through a pilot deployment with this group would have only covered 31.71% of the estate (hardware, apps, etc.).
Adding 592 devices gives you the remaining 68.29% to get to 100%. This also brings your redundancy from 11.53% to almost 70%, to take into account devices on vacation, transferred, etc. It is worth noting that, according to Microsoft, the number of pilot devices in this example is high as the importance level of apps has yet to be fully classified.
Microsoft's aim is not to have every app tested before starting your pilot deployment — but rather to enable you to use Desktop Analytics to find the most important apps and combine that data with any known drivers, antivirus, etc. issues that Microsoft's telemetry has received. After the first batch of devices has completed the pilot rollout, you can start reporting back in with any issues and other health data. This is supposed to help you to fine-tune your pilot deployment from there.
One thing the presenters stressed over and over was how Microsoft is using telemetry data they collect and is sharing that knowledge, as well as giving meaningful insights to transform how an enterprise prepares and plans for a migration. They also discussed how Microsoft is trying to alleviate some of the common pain points of migrations like WAN pressure, Application Compatibility, and managing users across the organization.
Reading The Data For Proof
During its talk, Microsoft stressed the usefulness of the data Desktop Analytics receives not only during the migration, but before as well. For example, if a business unit manager claims that the new update crashes Excel all the time, you now have the data to show him or her that it is actually crashing at a lower percentage than before the update.
Obviously, the more session data is reported back, the more powerful the reporting dashboard becomes. This allows IT pros to see where issues are and which versions, which devices, what hardware setups, etc. are causing them. Since this data is enriched with global telemetry data from Microsoft, you can also see if it makes sense to switch back to an older version or pause your rollout.
They also mentioned how reporting now only takes 10-15 minutes rather that the usual 24 hours, which is important in zero-day vulnerabilities, where you can quickly show when the issue started, how long it took to patch your devices, and how many are left.
Final Thoughts & Recommendations
One common theme during the presentation was that Desktop Analytics will start off with the most basic functionality and will expand over time. With all the improvements, Desktop Analytics will certainly be a significant improvement over Windows Analytics. However, other than the initial pilot phase recommendations, you are still left with a lot of heavy lifting.
While Desktop Analytics, once fully matured, has the promise to become a useful supplemental data source, it certainly isn't an adequate tool to manage your readiness, scheduling and deployments. Once it has been released, we will check back in and run a more thorough side-by-side comparison and give you deeper integration suggestions — so stay tuned.


![Windows 11 Enterprise Vs. Professional [A Comparison]](https://blog.juriba.com/hs-fs/hubfs/Windows%2011%20Enterprise%20Vs.%20Professional%20%5BA%20Comparison%5D.jpg?width=1600&height=900&name=Windows%2011%20Enterprise%20Vs.%20Professional%20%5BA%20Comparison%5D.jpg)


.png?width=1920&height=1492&name=Juriba%20-%20Windows%2011%20Assessment%20Service%20(Hardware%20II).png)
.png)
