
Have you ever heard the saying, "You cannot manage what you don't measure?" This is true for projects of all sizes, but even more so for large IT transformation projects, whether they be a virtual desktop infrastructure upgrade, a hardware refresh, Windows 10 or Office 365 migration.
As any seasoned IT project manager knows, juggling tens of thousands of assets and users, dozens of locations and lines of business, and hundreds of resources is just impossible without properly measuring the activities. You will have to put some specific business metrics around each step of the project that can be measured, analyzed, and acted upon. Most projects underestimate the amount of reporting that will be required to support the sponsors, stakeholders and resources involved in the delivery. These are your Key Performance Indicators!
What are Key Performance Indicators (KPIs)?
According to SearchTarget, "a key performance indicator (KPI) is a business metric used to evaluate factors that are crucial to the success of an organization [or a project]. KPIs differ per organization." In your case, KPI's will center around the progress being made in migrating your users onto Windows 10, Office 365, a new hardware fleet and so on, and we will explore today which in particular you should be tracking and using to measure success.
Without defining, measuring and monitoring the proper project-specific key performance indicators:
- Your project will possibly stretch on for months, sometimes even years, longer than initially planned without any real idea of why it is happening.
- You will have no handle on how much project resource capacity you have or how to make the best use of them.
- Reporting on the status of the project becomes a nightmare because you don't know which metrics are important.
IT Transformation / Migration Project Specific KPIs
Every organization and every IT migration or transformation project is different and will need its set of specific key performance indicators. However, to help you get started, we compiled a list of more than 30 KPI's that you should be tracking for an example Windows 10 migration project. Of course, if your project is a mobile device refresh, a data center migration or a unified communication upgrade, you will focus your metrics on areas specific to this migration type.
We will focus our attention mostly on three parallel workstreams — Application Readiness, Migration Readiness, and Deployment — before we go into migration and post-migration issues in the Help Desk KPIs.
Application-Related KPIs
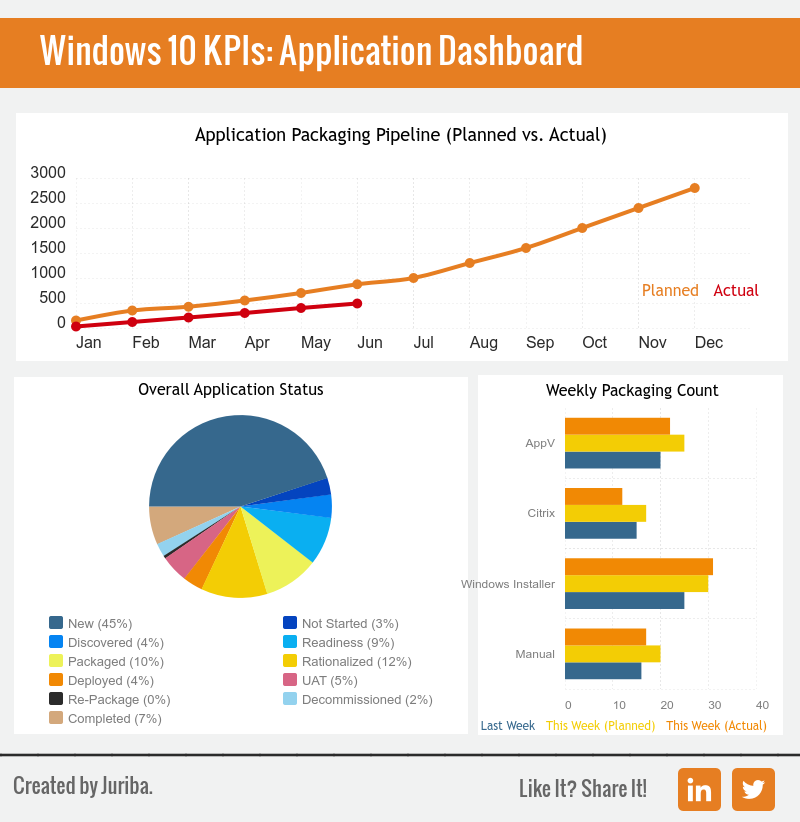
- Planned vs. Actual Packaging Pipeline: This metric gives you an overview of how much progress has been actually made compared to the forecasted packaging pipeline. You can visualize both progressions over a period of time (e.g., months) which enables you to see potential problems, such as an ever-widening gap between planned and actual.
- Overall Application Status: The overall application status indicates the number of applications that are in the following states: new, not started, discovered, readiness, packaging, remediation, user acceptance testing, re-packaging, deployed, decommissioned, or completed. This is usually visualized as a pie chart. As you are moving through your project, you should have fewer assets in the beginning steps in the sequence as they move through the migration process.
- Weekly Application Status: In order to get numbers on the board, the project should be managed in sets of little sprints and therefore you should track your weekly progress. The sequence steps are the same as with the overall application status, but you compare the progress in each step made from week to week — including the variance and users impacted.
- Weekly Packaging Count: Depending on your project, the delivery method will change, but for the average Windows 10 migration project, you are probably looking at manual, Windows Installer, AppV and Citrix. For this KPI, you should track how much your team packaged last week, has packaged this week and is planning to get done this week.
- Daily Packaging Status: In addition, you can track the daily packaging status (e.g., Incoming, Yesterday, Today, Target) in the following phases: Discovery, Pipeline, Sequencing, Sequencing on Hold, User Acceptence Testing, User Acceptence Testing on Hold, Pre-Production, and Completed.
An application KPI dashboard could look something like this:
Migration Readiness Related KPIs
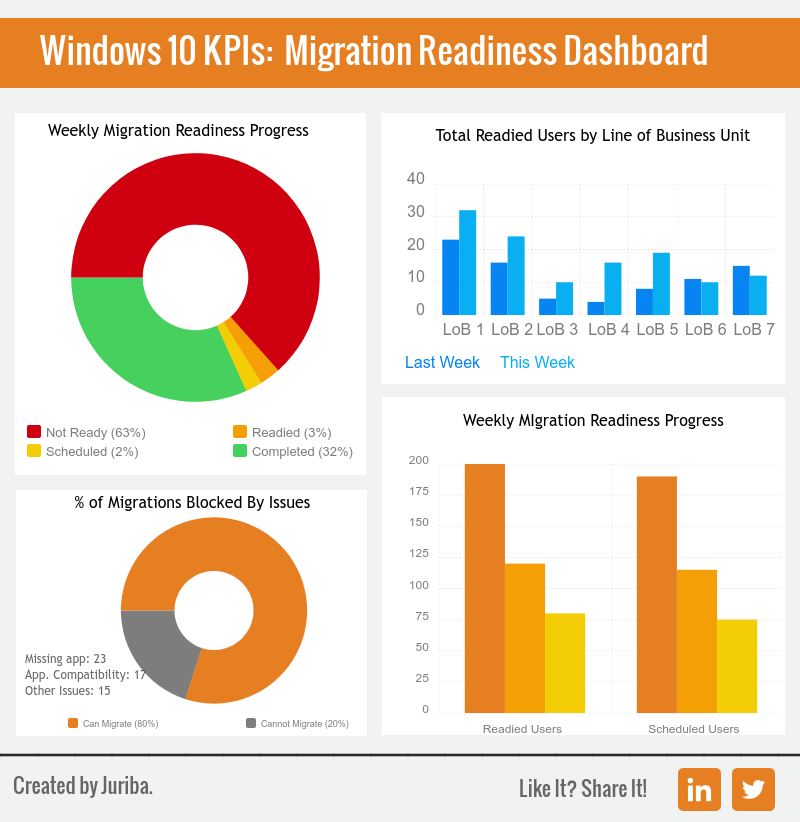
- Overall User Migration Readiness Status: This is one of the key levers to move your migration forward. Track how many of your total users are not ready, ready, scheduled, or completed (as a piechart) to understand how quickly (or slowly) your team is getting assets ready, scheduled or completed in relation to the overall number of assets that need to be migrated.
- Total Readied Users by Business Unit or LOB: Numbers don't lie and this KPI will allow you to figure out how many numbers you are getting on the board from week to week in each business unit as well as if there are any potential bottlenecks or low hanging fruit in the different business units. Compare the progress made this week versus last week and even over time in a bar chart.
- Weekly Candidacy and User Acceptance Testing App Progress: Use a table to chart down how many users your team was able to move towards user acceptance testing this week versus last week.
- Weekly Migration Readiness Progress: Lastly, measure the progress made this week versus last week and even compare it to the planned number for this week in terms of readying assets and scheduling users for migrations. You can show off your progress in a bar chart.
- Breakdown of Risks & Issues: Be aware of risks and issues associated with your migration project by mapping out your key concerns (e.g., SCCM upgrade needed, server capacity available, networking upgrade) including the expected impact (high, medium, low), a due date, and the owner.
Migration Readiness KPIs could be visualized in a dashboard like this:
Deployment-Related KPIs
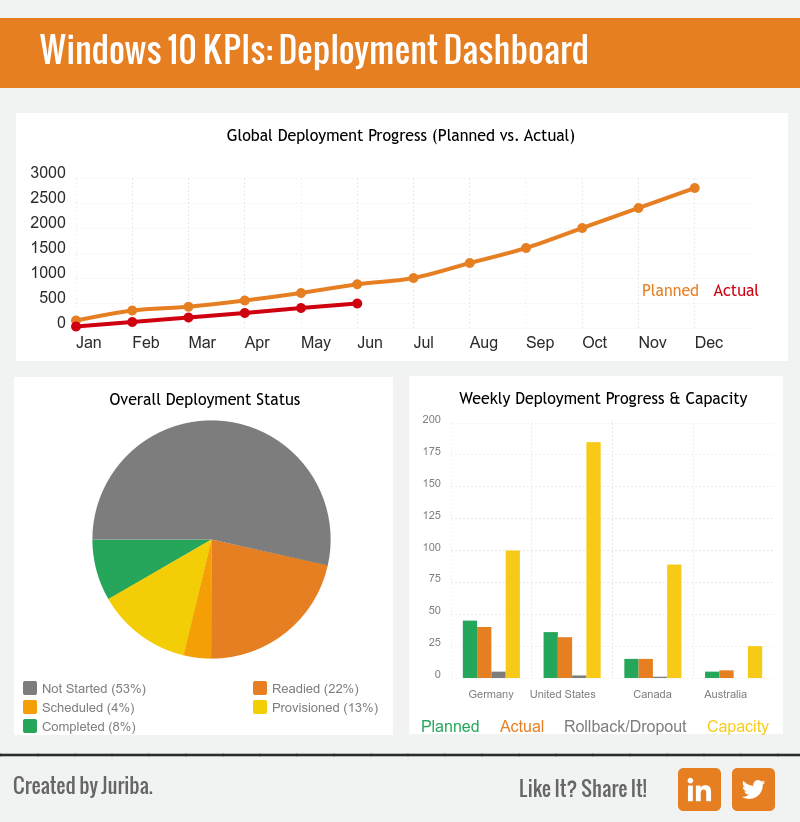
- Deployment Progress (Planned vs. Actual): One of the key performance indicators to show your month-over-month deployment progress is the Deployment Progress chart. This metric indicates the number of deployed assets in reality versus those planned in each calendar month. As the deployment progress drops off as the months progress, you will know you need to put more man power into your deployment team,
- Overall Deployment Status: Use this KPI to understand how your project is progressing in terms of deployment overall. You can do so by tracking the number of users in each state (e.g., Not Started, Ready, Scheduled, Provisioned, and Completed) and visualize them in a piechart.
- Weekly Deployment Breakdown by LOB: This KPI allows you to breakdown the number of deployments achieved each week in each business unit by tracking the number of assets that were planned, are deployed, rolled back, have dropped out, are ready or completed on a weekly basis.
- Weekly Deployment Progress: Use this metric to measure how many assets are in which deployment stage (e.g., Planned, Actual, Rollback / Drop-Out) for each geography and compare them to the locally available capacity. If visualized as a bar chart, this gives you a powerful tool to find under-or over-utilization as well as opportunities for optimization.
Additional KPIs could be:
- Average # of Assets Deployed Per Day/Scheduler
- Average Time Per Deployed Asset (in Hours)
Finally, deployment related KPIs can be summarized in a dashboard that looks like this:
Migration and Post-Migration Issues & Help Desk Related KPIs
- Open and Aging Incidents: Keep track of the number of assigned, in progress, and on-hold issues over certain periods, such as 30 days old, 20-30 days old, 10-20 days old, 5-10 days old, 2-5 days old, or 1-2 days old.
- Weekly Top Issues: This is more of a metric to track than a KPI to achieve, but nevertheless, it's important for the success of your project. If you can track and categorize each issue and identify which gives your team the biggest headaches, you know what to tackle first in order to eliminate a lot of service tickets and user frustration.
- Overall UAT and Post Go-Live Incidents: Use this KPI to compare your week-over week progress regarding the following: Incoming Incidents, Resolved Incidents, Open Incidents, Resolution Rate, User Migration Rate, Unique Users With Issues, and Average Tickets per User.
- Percentage of Migrations Blocked by Issues: To find out how many migrations can go forward versus how many are blocked and by which issues, you can keep an eye on the number of missing apps and the number of application issues.
- Application User Acceptance Testing (UAT) Aging: Map the number of applications that are currently undergoing user acceptance testing by assigning the number (e.g., over 19 days old, 16-19 days old, 11-15 days old, 6-10 days old, 1-5 days old, less than 1 day old). You can break this out by business unit or month-over-month.
Pull All KPIs Together In An Executive Scorecard
Now, that you have defined which key performance indicators you will track measure success by, you can pull them together into customized scorecards based on the informational needs of your different audiences. For example, it pays to have an executive "State of the Union" scorecard to be able to gain an overview of your project at a quick glance. For this, you can include:
- If major milestones have been met on time (Yes/No)
- Progress made over time (month-over-month)
- Capacity vs. Utilization to identify any under-utilized areas
- Planned vs. Actual to find potential bottlenecks
- Packaging Process (Gauge in 20% steps): Planned Weeks vs. Actual Weeks of Overall Planned
- Number of applications in User Acceptance Testing vs. On Hold & Aging (in Days)
- Moved/migrated (in percent of total)
- Decommissioned or completed (in percent of total)
These are just some of the metrics that we consider essential in running a successful IT migration project. Without early consideration of the reporting needed, and how you are going to gather and present the data, this role alone can require dedicated resource(s). That is why, at Juriba, we are so passionate about making this process as simple as possible. By utilizing a project data warehouse, you can have a single, authoritative source for your data and can cut, slice and dice to present the visualizations you need to demonstrate project progress.
If you are looking for ways to accelerate your IT transformation project, download our brand-new eBook. While it walks through a Windows 10 migration in particular, the same principles can be applied for other migration projects as well.

Topics:


